sara silva's portfolio:
tableau_


Since I had no experience in Tableau and I was becaming very curious about this tool, I've picked this dataset and I've tried to come up with a nice and clean dashboard, that would be able to answer the following questions:
What is the overall diversity profile of the organization?
What are our best recruiting sources if we want to ensure a diverse organization?
Is there any relationship between who a person works for and their performance score?
These questions are available within the Kaggle page from where I got this dataset and served as an inspiration for some of the visuals on this dashboard.
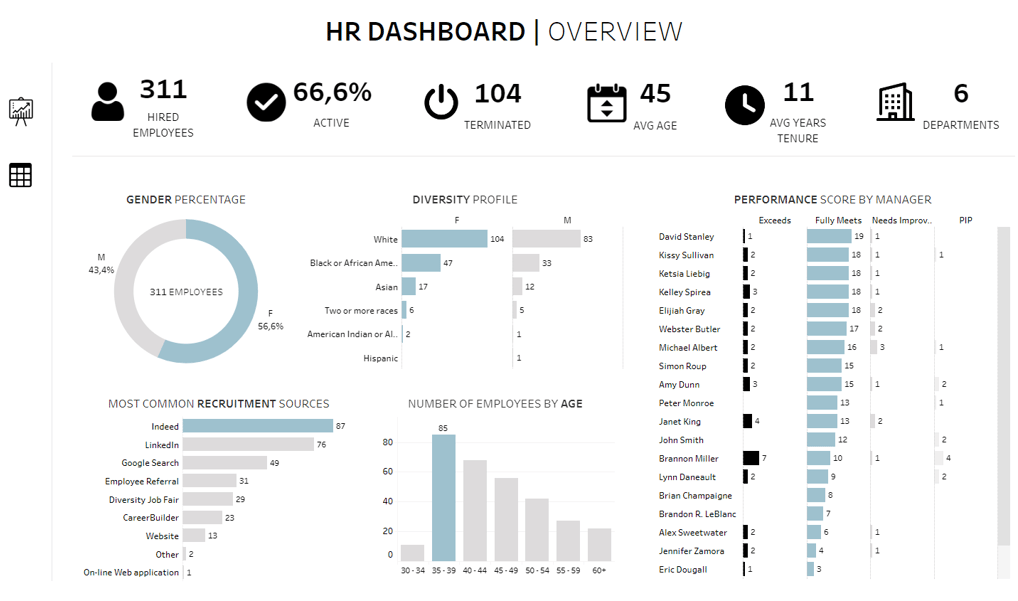
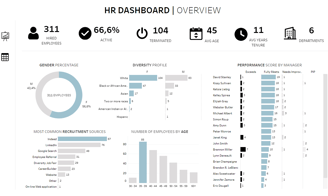
data visualization: hr dashboard_
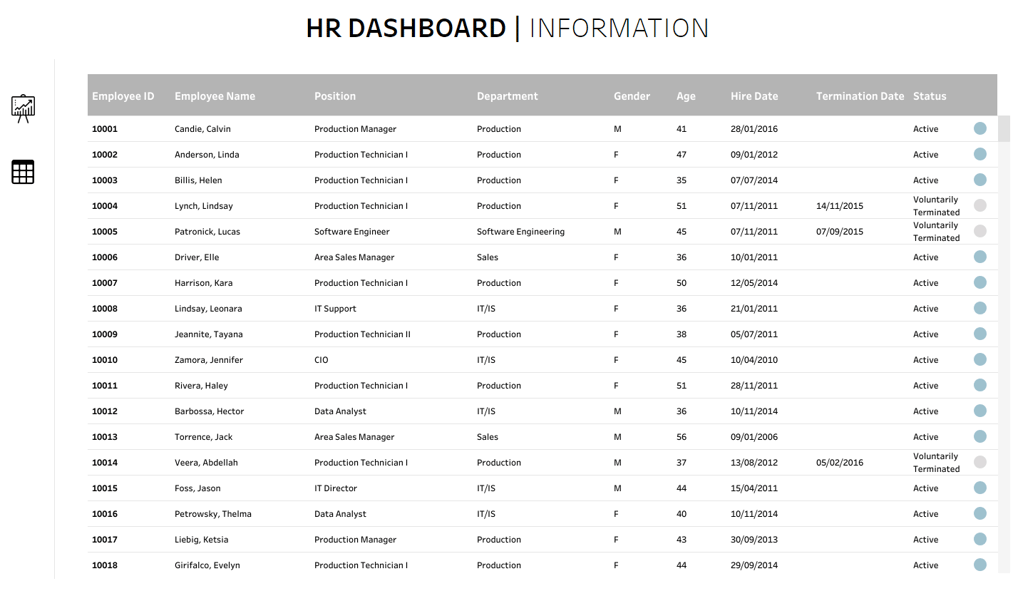
This dashboard has two sections:
Overview - with general information of the dataset, as well as some visuals that allow a deeper analysis and answer some business questions;
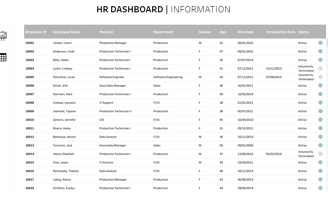
Information - with one big table, displaying the most important columns of the dataset and enabling the possibility to search for specific information.
Lessons learned:
how to design and set up the side navigation, which enables the user to switch pages;
how to add useful information and charts to the tooltips, which is visible on hover;
how to write the formulas for the calculated fields.
Check the project here.
Note: The focus of this project was on Data Visualization. The dataset was already fully cleaned, so no Data Cleaning tasks were performed.